steps
steps
step color
Color of the steps.
step opacity
Opacity of the steps.
show mouse cross
Displays the mouse cursor as "cross".
full cursor width
When ON, the cursor width is equal to the steps width.
big step color
Color for the big steps according the big step interval parameter.
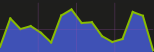
 Example with big steps in Blue.
big step interval
Interval between two big steps.
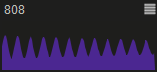
Example with interval=7
show step border
Displays the step border.
 With border
 Without border
step border color
Border color
Only if show step border is ON.
 blue border
Step color
Color of the steps.
draw mode
Determines how the module draws the steps.
4 modes are available:
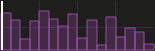
Draw bars
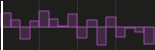 Draw symmetric
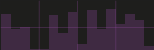
 Draw small bar
 Draw lines
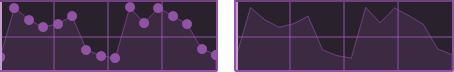
mode fill
Fill the form with color.
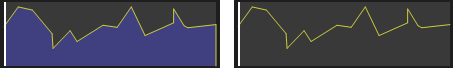 Mode fill ON and OFF
fill color
Color used to fill lines.
 Blue fill color
fill opacity
Determines the fill opacity.
Only when mode fill is ON.
 Example with 2 different opacity values.
horizontal scale
Sets the horizontal scale for the steps: normal or logarithmic.
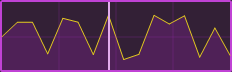
 Example for normal and log
line color
Color of the lines.
 Yellow line on a data-generator-sequenced-lines.
line width
Line width (thickness) in pixels.
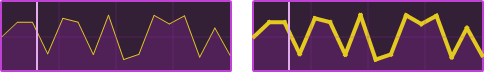 *pixel and 4 pixels line on a data-generator-sequenced-lines.
pixel color
Color used to draw pixels and lines.
pixel size
Size used to draw pixels or lines.
![]()
point size
Size of selector points in pixels.
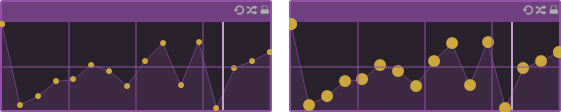 Example of different sizes on a sequenced-points-curve.
points color
Color of the selector points.
 Example on a sequenced-points-curve.
select tolerance
Precision tolerance in pixels for the point selection.
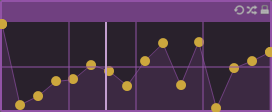
show points
Displays or not the selector points on the curve.
 Option ON and OFF
vertical scale
Vertical scale for the steps: normal, logarithmic or exponential.
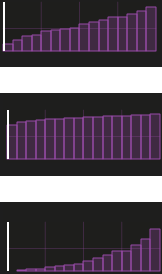 Example for normal, logarithmic and exponential
display value on mouse over
Displays the value of the current step or point on mouse over.
version 6.0.241021
Edit All Pages